Crash analysis on iOS/macOS/visionOS
For crashes on native (iOS/macOS), Unity (iOS/macOS/visionOS), and Unity editor (macOS), refer to the following notes.
Obtain crash locations during development
The information needed when debugging in XCode is shown below.
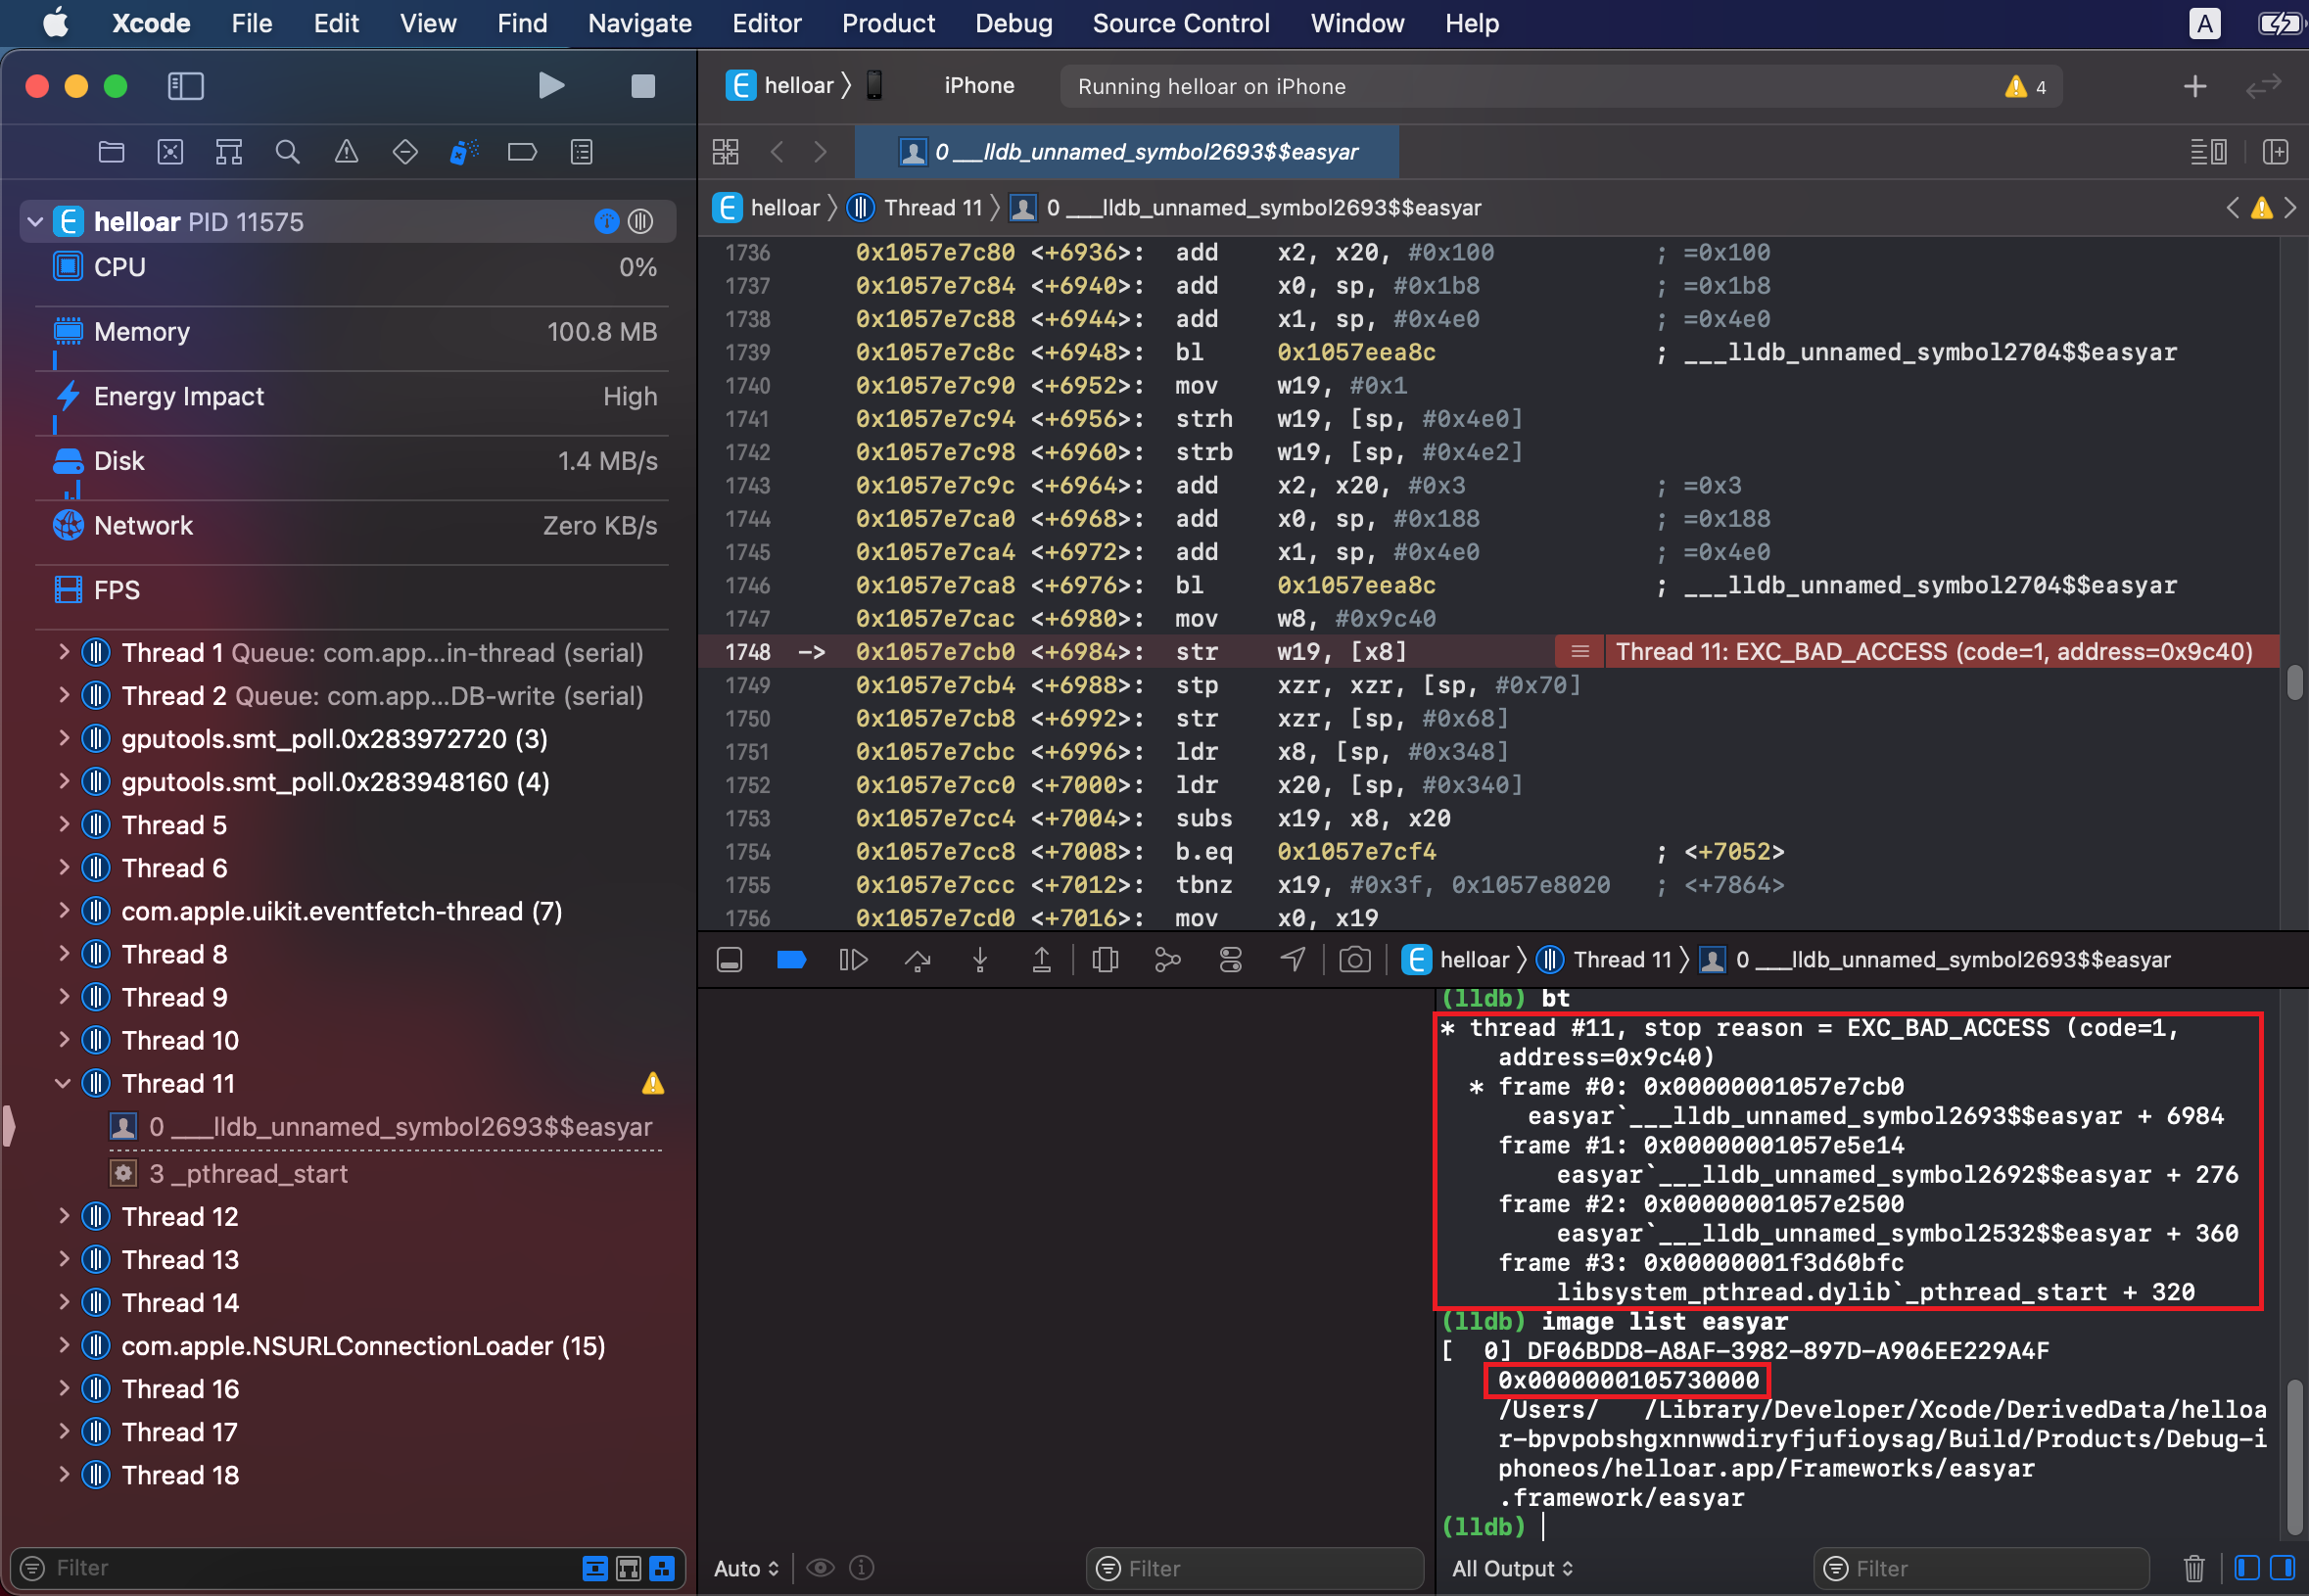
Enter bt in lldb to obtain the crash reason and code running stack, as shown below.
(lldb) bt
* thread #11, stop reason = EXC_BAD_ACCESS (code=1, address=0x9c40)
* frame #0: 0x00000001057e7cb0 easyar`___lldb_unnamed_symbol2693$$easyar + 6984
    frame #1: 0x00000001057e5e14 easyar`___lldb_unnamed_symbol2692$$easyar + 276
    frame #2: 0x00000001057e2500 easyar`___lldb_unnamed_symbol2532$$easyar + 360
    frame #3: 0x00000001f3d60bfc libsystem_pthread.dylib`_pthread_start + 320
When the code running stack contains content related to easyar or libEasyAR.dylib, the crash may be related to EasyAR. If it does not, there is a high probability that the crash is unrelated to EasyAR.
Enter image list easyar or image list libEasyAR.dylib in lldb to obtain the dynamic library load address, as shown below.
(lldb) image list easyar
[  0] DF06BDD8-A8AF-3982-897D-A906EE229A4F 0x0000000105730000 /Users/<user>/Library/Developer/Xcode/DerivedData/helloar-bpvpobshgxnnwwdiryfjufioysag/Build/Products/Debug-iphoneos/helloar.app/Frameworks/easyar.framework/easyar
Obtain crash locations during development (Unity)
When developing applications with Unity, you can also use Unity logs to analyze crashes.
Unity logs are divided into Unity editor logs and Unity player logs, which can be obtained as follows.
| Unity environment | Operating system | Log path |
|---|---|---|
| Editor | macOS | ~/Library/Logs/Unity/Editor.log |
| Player | iOS | Use XCode's lldb console |
| Player | macOS | ~/Library/Logs/Company Name/Product Name/Player.log |
Editor logs can also be opened with the Open Editor Log command in the menu at the upper right of the Console window.
Managed exceptions (C#) can be viewed in the Console window of the Unity editor (Window -> General -> Console in the Unity main menu).
Obtain crash locations after release
Crashes may also occur after release. At this time, view them from the device's Privacy - Analytics & Improvements - Analytic Data, or collect crash logs through TestFlight and the App Store.
The following is an example of a crash:
Incident Identifier: 5916E252-D8C2-43C3-B583-7E38399597C9
CrashReporter Key:   2075d595d8d96cf07913a12798d5e0aba79c5358
Hardware Model:      iPhone9,2
Process:             ARManualEditorDemo [2352]
Path:                /private/var/containers/Bundle/Application/ED9F6959-612A-4595-A7B9-3F573B5097DD/ARManualEditorDemo.app/ARManualEditorDemo
Identifier:          cn.easyar.demo.ARManualEditor
Version:             6 (2.0.1)
Code Type:           ARM-64 (Native)
Role:                Non UI
Parent Process:      launchd [1]
Coalition:           cn.easyar.demo.ARManualEditor [1831]


Date/Time:           2019-09-17 16:21:13.1246 +0800
Launch Time:         2019-09-17 16:08:08.3605 +0800
OS Version:          iPhone OS 12.4 (16G77)
Baseband Version:    5.70.01
Report Version:      104

Exception Type:  EXC_BREAKPOINT (SIGTRAP)
Exception Codes: 0x0000000000000001, 0x000000019d7e86fc
Triggered by Thread:  0

Thread 0 name:  Dispatch queue: com.apple.main-thread
Thread 0 Crashed:
0   JavaScriptCore                	0x000000019d7e86fc WTFCrashWithInfo+ 2471676 (int, char const*, char const*, int) + 20
1   JavaScriptCore                	0x000000019dd85da0 llint_slow_path_get_by_val + 6032
2   JavaScriptCore                	0x000000019d7a25cc llint_entry + 34380
...
13  JavaScriptCore                	0x000000019d799cec vmEntryToJavaScript + 268
14  JavaScriptCore                	0x000000019dccb4d0 JSC::Interpreter::executeCall+ 7595216 (JSC::ExecState*, JSC::JSObject*, JSC::CallType, JSC::CallData const&, JSC::JSValue, JSC::ArgList const&) + 424
15  JavaScriptCore                	0x000000019dead560 JSC::profiledCall+ 9569632 (JSC::ExecState*, JSC::ProfilingReason, JSC::JSValue, JSC::CallType, JSC::CallData const&, JSC::JSValue, JSC::ArgList const&) + 188
16  JavaScriptCore                	0x000000019d7df170 JSObjectCallAsFunction + 376
17  EasyARPlayer                  	0x000000010353d284 0x10326c000 + 2953860
18  EasyARPlayer                  	0x000000010363c880 0x10326c000 + 3999872
19  EasyARPlayer                  	0x000000010364ee1c 0x10326c000 + 4075036
20  EasyARPlayer                  	0x0000000103295388 0x10326c000 + 168840
21  GLKit                         	0x00000001a337b91c -[GLKView _display:] + 256
...
33  libdyld.dylib                 	0x0000000195e468e0 start + 4

...

Thread 8:
0   libsystem_kernel.dylib        	0x0000000195f92ee4 __psynch_cvwait + 8
1   libsystem_pthread.dylib       	0x000000019600dcf8 _pthread_cond_wait$VARIANT$mp + 636
2   easyar                        	0x0000000102fba7c0 0x1028b4000 + 7366592
3   easyar                        	0x0000000102e7627c 0x1028b4000 + 6038140
4   easyar                        	0x0000000102e452e8 0x1028b4000 + 5837544
5   libsystem_pthread.dylib       	0x00000001960152c0 _pthread_body + 128
6   libsystem_pthread.dylib       	0x0000000196015220 _pthread_start + 44
7   libsystem_pthread.dylib       	0x0000000196018cdc thread_start + 4

...

Binary Images:
0x1023e4000 - 0x1024f3fff ARManualEditorDemo arm64  <0fb0d9b7d18c3e2ebf44e950a68af61f> /var/containers/Bundle/Application/ED9F6959-612A-4595-A7B9-3F573B5097DD/ARManualEditorDemo.app/ARManualEditorDemo
...
0x1028b4000 - 0x10310bfff easyar arm64  <cb52ccf821e33255a0c30ca2422d2862> /var/containers/Bundle/Application/ED9F6959-612A-4595-A7B9-3F573B5097DD/ARManualEditorDemo.app/Frameworks/easyar.framework/easyar
...

EOF
The code stacks containing easyar include:
2   easyar                        	0x0000000102fba7c0 0x1028b4000 + 7366592
3   easyar                        	0x0000000102e7627c 0x1028b4000 + 6038140
4   easyar                        	0x0000000102e452e8 0x1028b4000 + 5837544
Here, 0x0000000102fba7c0 is the virtual address of the code in memory, 0x1028b4000 is the module load address of easyar, and 7366592 is the offset.
The Binary Images section also shows that 0x1028b4000 is the module load address of easyar.
Note that crash information must include both the code running stack and the module load address. Because of ASLR (address space layout randomization), the dynamic library module load address may be different each time the program runs, which also causes code addresses to change dynamically. Only when you know the relative value between the code address in the code stack and the dynamic library module load address can you determine where the program crashed.
When the code running stack contains content related to easyar or libEasyAR.dylib, the crash may be related to EasyAR. If it does not, there is a high probability that the crash is unrelated to EasyAR.
Other crash-related information
Version numbers of EasyAR Sense and EasyAR Sense Unity Plugin
For example, 4.7.0.11800-cf8e24e30
Community edition/Enterprise edition
Platform and CPU architecture
iOS
arm64
macOS
x86_64/arm64
visionOS
arm64