Log analysis on WeChat mini-programs
This article introduces the complete process of log acquisition and analysis in the WeChat mini-program AR environment.
Using WeChat mini-program vConsole
Since WeChat mini-program AR can only run and debug on physical devices, using vConsole to observe real-time output is key to debugging. Basic usage can refer to the WeChat mini-program official documentation.
How to enable vConsole in physical device debugging
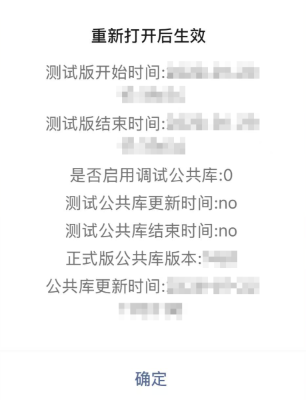
Click the first button in the upper right corner of the AR interface > Click Development Debugging in the bottom toolbar > Click Open Debugging > Click OK in the pop-up window to restart the mini-program.
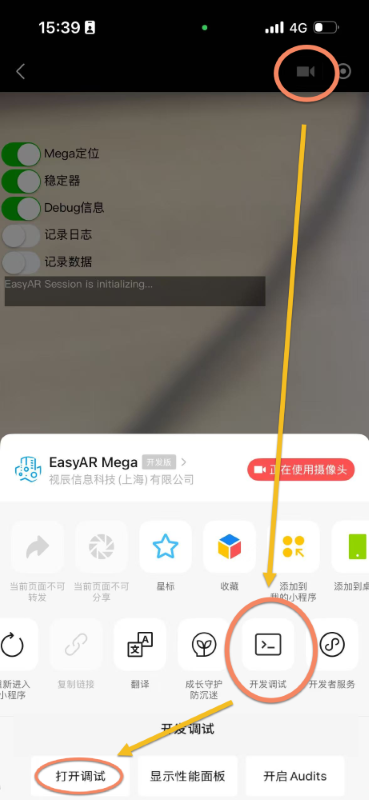
Afterwards, the vConsole floating button will be continuously displayed on the interface.
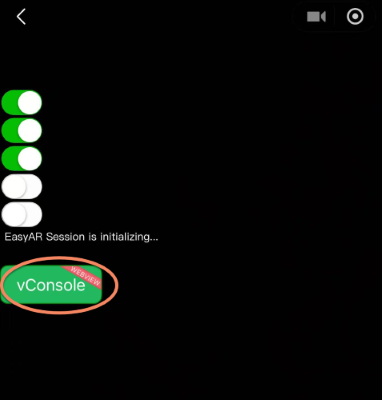
Click the vConsole button to view all current running logs:
How to distinguish log sources
Log sources can generally be divided into:
WeChat mini-program system logs: Usually triggered during page routing jumps or component lifecycle changes, displayed in blue text in vConsole.
xr-frame logs: Printed by the official rendering framework, log content starts with
[xr-frame].User-defined logs: Printed by developers through standard interfaces like
console.log().Mini-program framework error logs: Thrown by the WeChat underlying layer, content starts with
MiniProgramError.Mega mini-program plugin logs: Printed internally by the Mega mini-program plugin, log content starts with class names enclosed in brackets (such as [MegaTracker]), currently mainly output when catching exceptions.
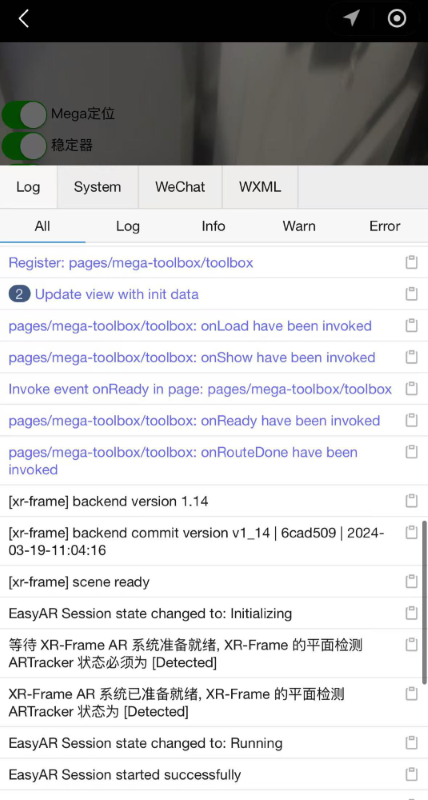
Example 1:
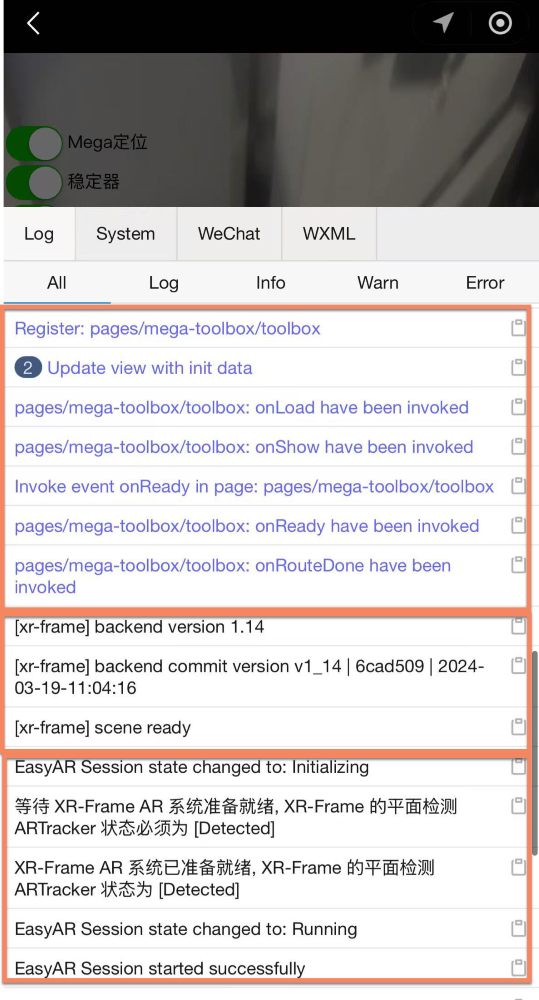
The first part in blue is the system log, showing page routing and loading status.
The second part starts with
[xr-frame], showing the rendering framework's lifecycle information.The third part is developer-defined output.
Example 2:
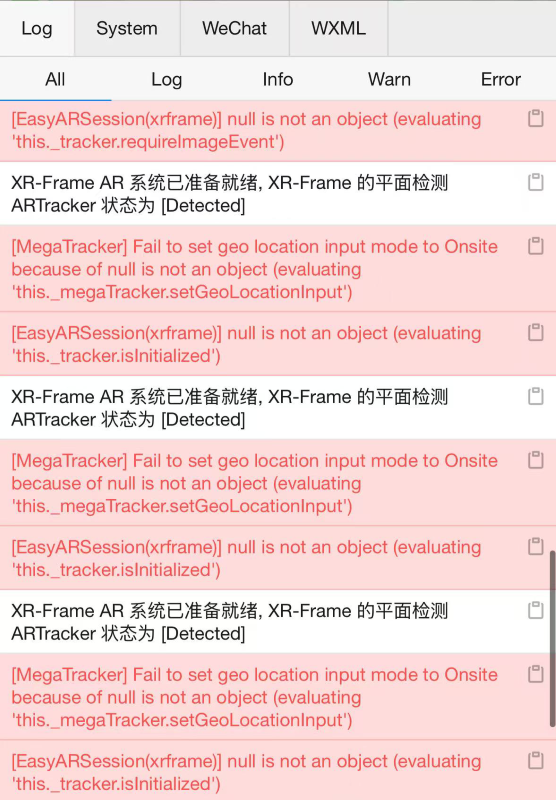
Logs starting with class names like
[MegaTracker],[EasyARSession(xrframe)]appear, indicating that the Mega plugin caught a runtime exception.Example 3:
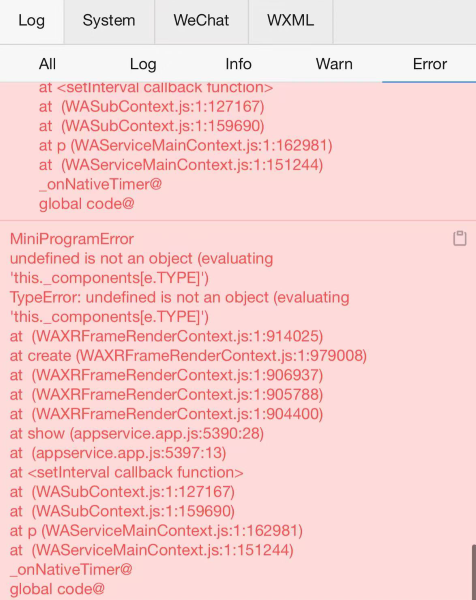
MiniProgramErrorcontainsWAXRFrameRenderContext.js, indicating a problem with the interface or component configuration related to xr-frame.Example 4:
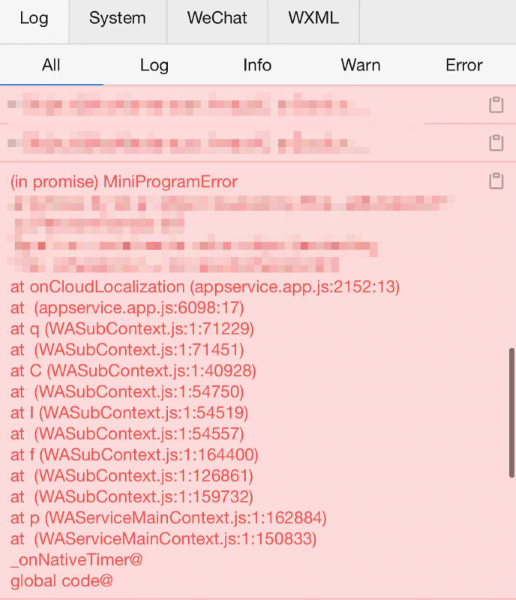
This log indicates that the
onCloudLocalizationmethod in the mega plugin encountered an exception during runtime, causing the mini-program framework to throw an error.
Log format of the Mega mini-program plugin
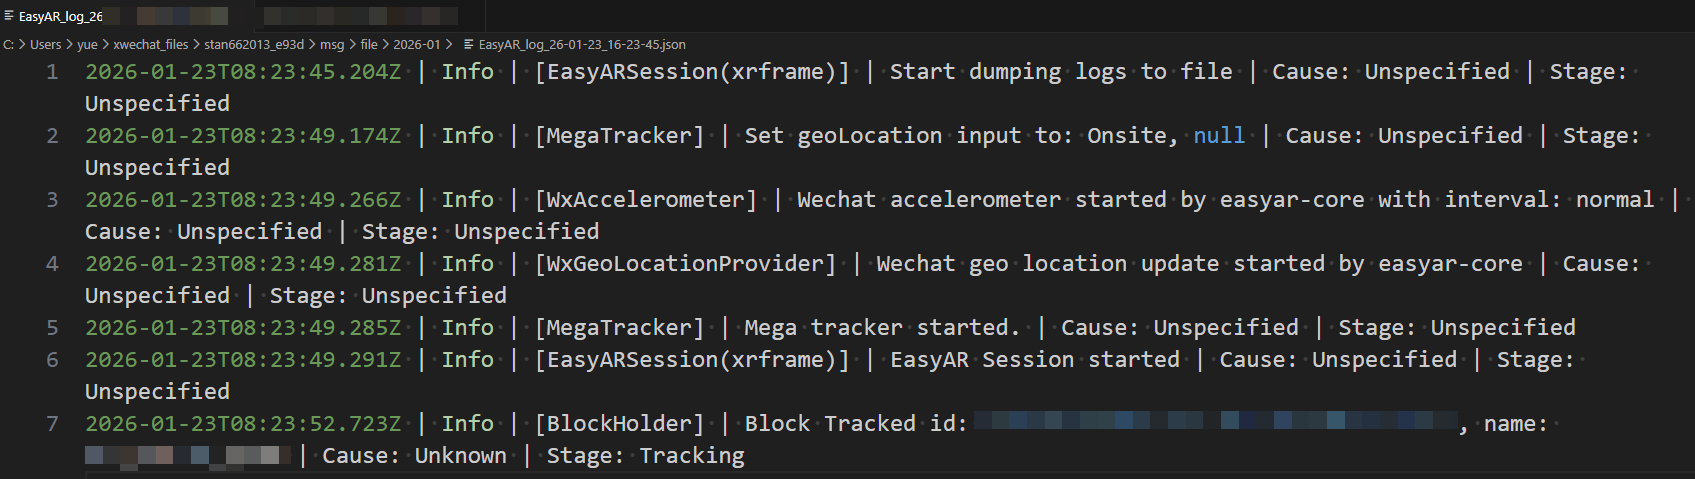
Logs exported by the dumpLog(signal) method are separated by |, with content in the following order:
- Timestamp:
ISO 8601standard format, indicating the system time when the log was printed. - Log level: Includes
Info,Warning,Error,FatalError. - Class name: Enclosed in brackets.
- Detailed information: Specific log description.
- Caller: Usually
Unspecified(indicating natural running process); if it's an exception caused by a user calling an interface, it shows asUser. - Running phase:
Unspecifiedmeans no need to pay attention; other fields indicate the exception occurred during a specific running phase.
How to record and forward logs
Introduces log acquisition and export solutions.
Exporting logs from vConsole
Click the copy button on the right side of the log printing location to export.
Mega mini-program plugin dump log interface
Control the log export process by calling the dumpLog(signal) interface:
- Pass
true: Start recording. - Pass
false: Stop recording and return the generated temporary file path (tempFilePath).
It is generally recommended to bind the recording logic to a UI button. When starting recording, prompt the start using the wx.showToast() method. When recording ends, forward the recorded file via WeChat chat using the wx.shareFileMessage() method.
/**
 * Handle Session recording logic
 * @param signal true to start recording, false to stop recording and forward
 */
dumpLog(signal: boolean): void {
  // Call interface to get path
  const logPath = session.dumpLog(signal);
  // When signal is true, the interface returns an empty string, indicating recording is in progress
  if (logPath.length == 0) {
      wx.showToast({
          title: 'Started recording logs',
          icon: 'success',
          duration: 2000
      });
      return;
  }
  // When signal is false, process the returned file path
  wx.shareFileMessage({
      filePath: logPath,
      success() {
          wx.showToast({
              title: 'Log forwarded successfully',
              icon: 'success',
              duration: 2000
          });
      },
      fail() {
          wx.showToast({
              title: 'Log forwarding failed',
              icon: 'error',
              duration: 2000
          });
      }
  })
}
This example demonstrates how to use the
session.dumpLog()method in the xr-frame component to record and forward log files, with corresponding Toast prompts.
Important
If you encounter localization or tracking-related issues rather than program exceptions when using Mega, please be sure to provide the screen recording file and session dump file from that time in addition to logs. Pure log files can only provide indirect references; screen recordings and dump data are the core basis for troubleshooting.