Make the most of UI diagnostics and tools
This article introduces how to quickly configure and use UI diagnostic information and developer mode tools to better debug and optimize applications during development and testing phases.
Reading UI messages
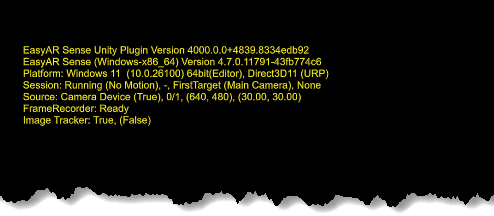
By default, when running an EasyAR Sense Unity Plugin application, diagnostic information is displayed via UI messages at the top of the screen, making it convenient for developers to understand the session's running status and issues.
Tip
These texts are not watermarks and can be shown or hidden as needed.
This information helps developers understand the session's running status and issues. It is recommended to keep it displayed during development and testing phases.
In the editor, select AR Session (EasyAR), and modify Message Output in the Inspector window to configure how UI messages are displayed. Among them, Message Output > Session Dump controls the display of session status information, while other options control how diagnostic messages of different levels are displayed.
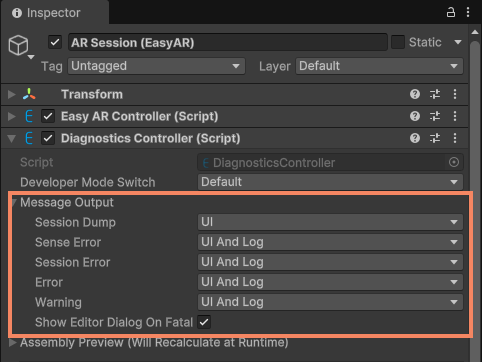
It is generally recommended to use the following configuration during development and testing phases:
- Message Output > Session Dump:
UI - Message Output > Sense Error:
UIAndLog - Message Output > Session Error:
UIAndLog - Message Output > Error:
UIAndLog - Message Output > Warning:
UIAndLog
For the release phase, use the following configuration:
- Message Output > Session Dump:
None - Message Output > Sense Error:
Log - Message Output > Session Error:
Log - Message Output > Error:
Log - Message Output > Warning:
Log
Using developer mode tools
By default, when running an EasyAR Sense Unity Plugin application, quickly tapping the screen 8 times will bring up the developer mode panel near the middle-right side of the screen. This allows developers to view and debug the session's running status and record data for simulation runs.
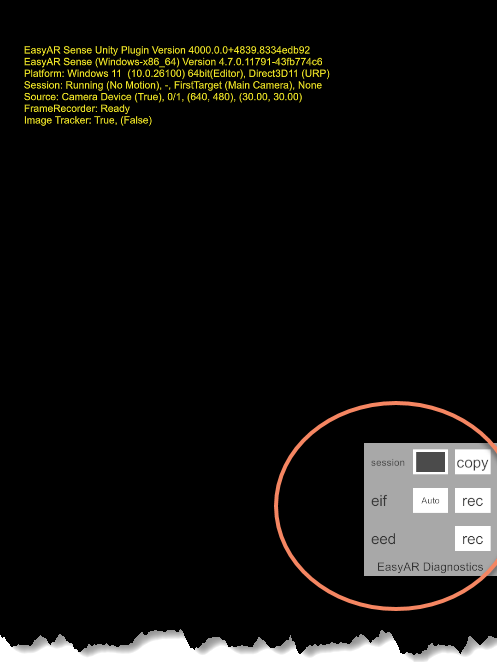
- You can toggle the display of information at the top of the screen using the switch button next to
session. - You can start or stop the EIF recording function using the
recbutton next toeif. Recorded EIF files are saved in the application's persistent data path, which can be obtained viaApplication.persistentDataPath.
To disable the developer mode panel, in the editor, select AR Session (EasyAR), and change Developer Mode Switch to Custom in the Inspector window.
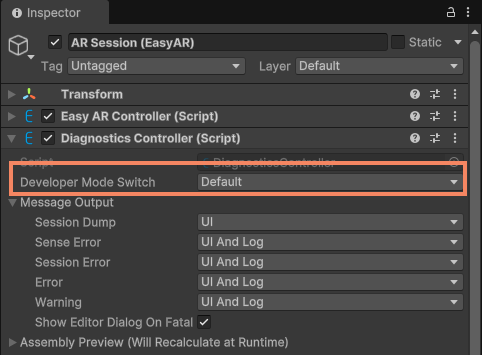
It is generally recommended to use the following configuration during development and testing phases:
- Developer Mode Switch:
Default
For the release phase, use the following configuration:
- Developer Mode Switch:
DefaultorCustom
If choosing Custom, it is recommended to ensure that online applications can use the diagnostic panel or a custom method to collect runtime data.
Further reading
- Introduction to diagnostics
- UI messages introduces how to use UI messages to display session status
- Developer mode introduces how to use developer mode for debugging